Category: Financial Modeling | Fundamental Analysis | Educational Report
Educational Disclaimer
Prepared under the FinOptions Financial Modeling Training Program for educational and learning purposes only. This report is not investment advice and has no commercial solicitation intent.
Report Details
- Prepared By: Anjali leve
- Guided By: Mr. Gaurav Somani, CFA, FRM
APAR Industries Ltd Company Overview
APAR Industries Ltd is a leading Indian manufacturer of conductors, transformer and specialty oils, power cables, telecom cables, polymers, and lubricants. Founded in 1958, the company operates across multiple business segments and serves domestic as well as international markets.
This APAR Industries Ltd company analysis report is prepared under the FinOptions Financial Modeling Training Program to help students understand business analysis, financial performance, shareholding patterns, and industry comparison.
Official Company Website
🔗 https://www.apar.com/
Key Highlights
| Particulars | Details |
|---|---|
| NSE Symbol | APARINDS |
| BSE Code | 532259 |
| Market Capitalization | ₹34,046 Cr |
| Industry | Specialty Manufacturing |
| Headquarters | Gujarat, India |
What This APAR Industries Ltd Company Analysis Report Covers
- Company overview and business model
- Revenue breakup by business segment
- Shareholding pattern analysis
- Key financial performance
- Financial ratios
- Subsidiaries and associate companies
- Management overview
- Peer comparison
Business Snapshot
APAR Industries operates across the following key segments:
- Conductors
- Specialty Oils & Lubricants
- Power & Telecom Cables
- Polymers
- Automotive Solutions
- Cable Solutions
The company has a diversified revenue base and a strong presence in both power transmission and specialty manufacturing sectors.
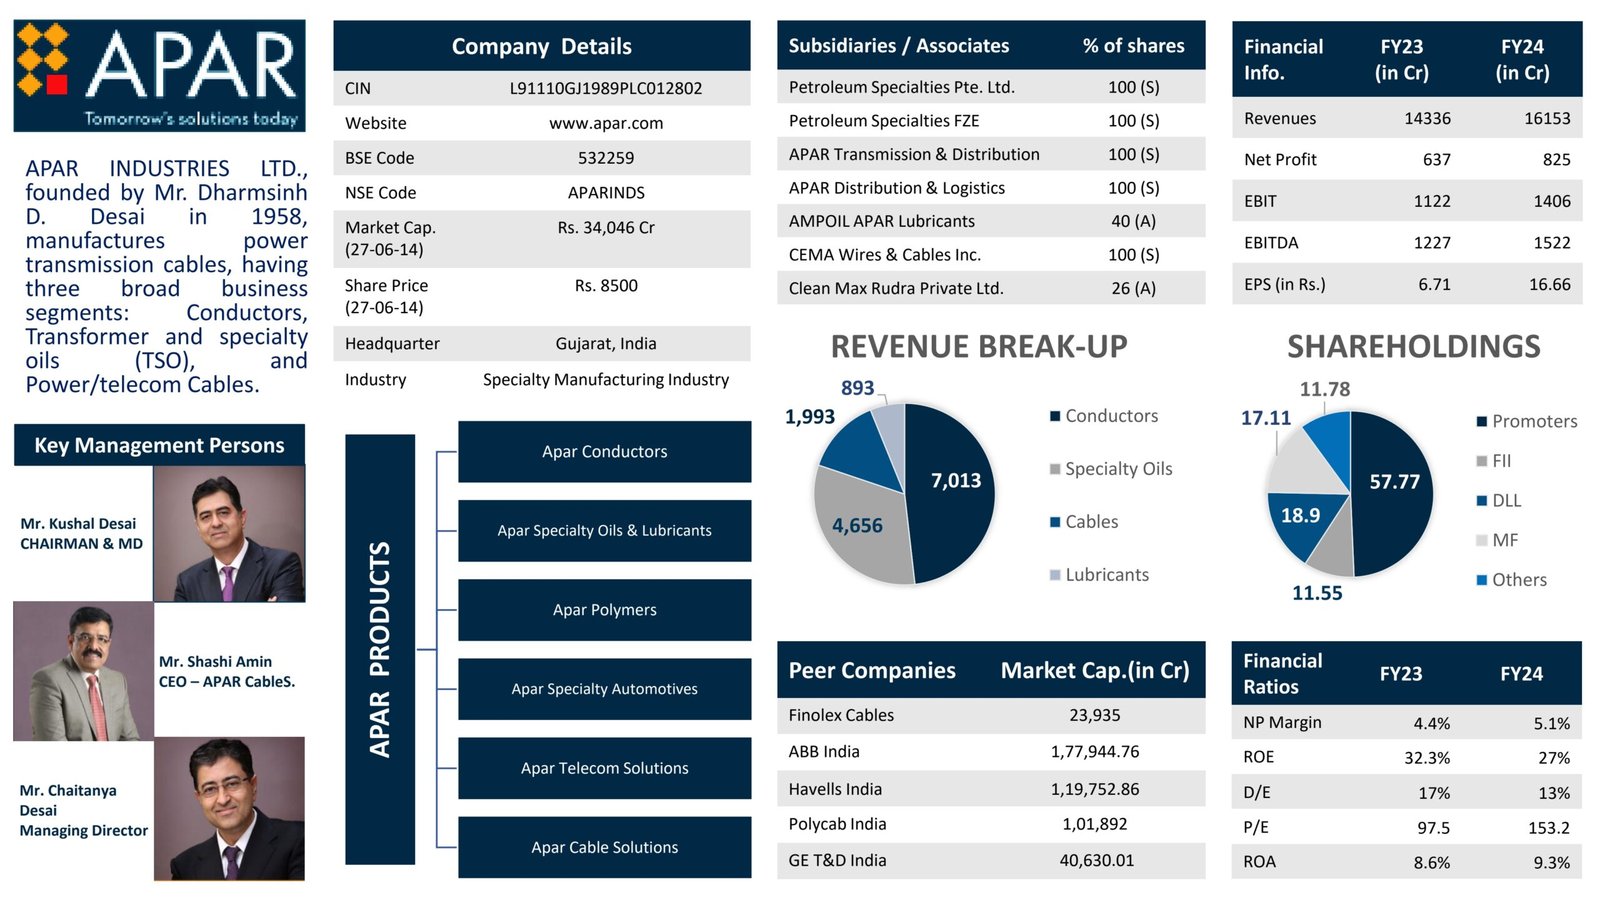
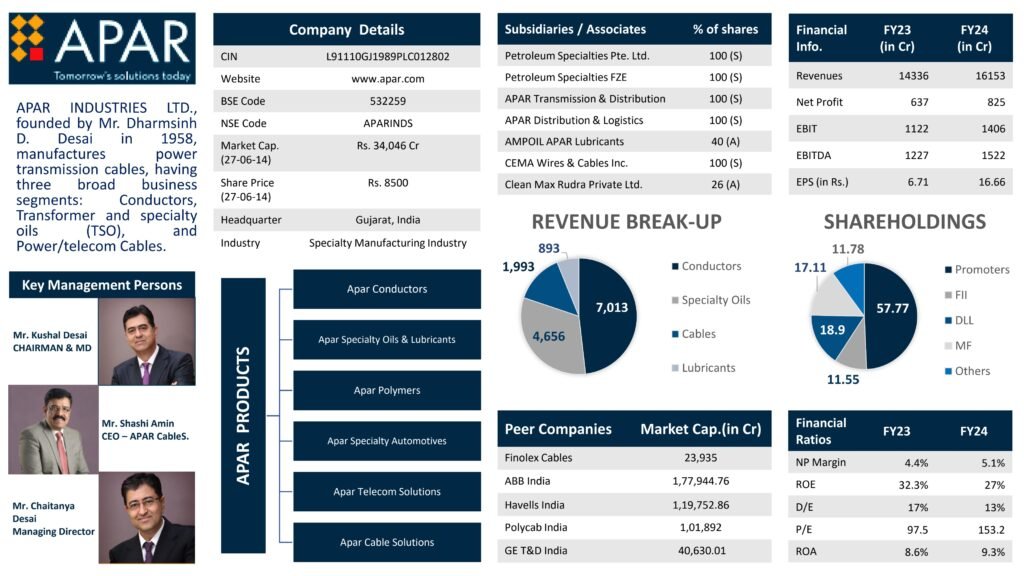
Revenue Breakup (FY24)
| Segment | Revenue (₹ Cr) |
|---|---|
| Conductors | 7,013 |
| Specialty Oils | 4,656 |
| Cables | 1,993 |
| Lubricants | 893 |
Conductors remain the largest contributor to the company’s revenue.
Key Financials
| Particulars | FY24 |
|---|---|
| Revenue | ₹16,153 Cr |
| Net Profit | ₹825 Cr |
| EBIT | ₹1,406 Cr |
| EBITDA | ₹1,522 Cr |
| EPS | ₹16.66 |
Shareholding Snapshot
- Promoters: 57.77%
- DII: 18.90%
- FII: 11.55%
- Mutual Funds: 11.78%
- Others: 17.11%
A strong promoter holding reflects long-term confidence in the business.
Key Management
- Mr. Kushal Desai – Chairman & Managing Director
- Mr. Shashi Amin – CEO, APAR Cables
- Mr. Chaitanya Desai – Managing Director
Major Competitors
- Finolex Cables
- Polycab India
- Havells India
- ABB India
- GE T&D India
Why This Report Is Useful for Students
This APAR Industries Ltd company analysis report helps students understand:
- Fundamental Analysis
- Segment-wise Revenue Analysis
- Financial Ratio Analysis
- Shareholding Interpretation
- Peer Comparison
- Business & Industry Analysis
Useful for Financial Modeling, Investment Banking, Equity Research, CFA, B.Com, BBA, and MBA Finance students.